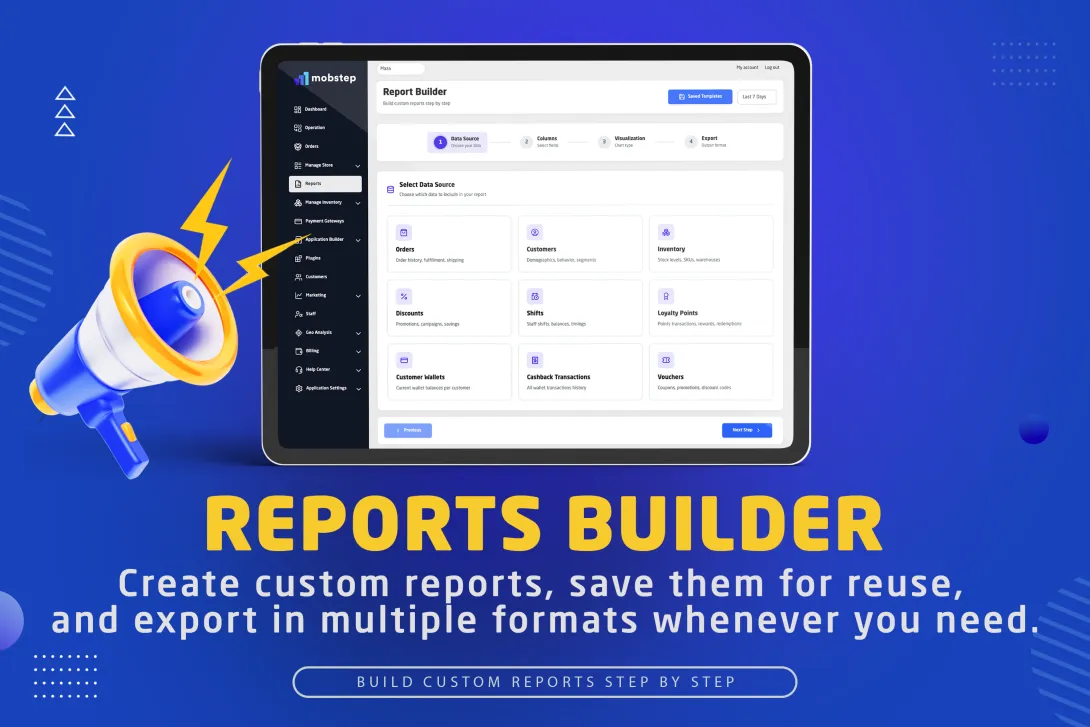
Why Reports Builder matters for Mobstep application owners
As an application owner on Mobstep you manage data across branches, customers, orders and promotions. The Reports Builder puts that data under your control — no developers or spreadsheets required. Build exactly the report you need, save it as a template, export in Excel/CSV/JSON/PDF and share insights across your team.
Benefits at a glance:
Faster decisions (live data, right metrics)
Less back-and-forth with developers
Reusable templates for recurring reporting
Exports ready for finance, ops or marketing
Quick overview: what Reports Builder can do
Connects to 9 data sources (Orders, Customers, Inventory, Discounts, Shifts, Loyalty Points, Customer Wallets, Cashback Transactions, Vouchers)
Pick only the columns you need (IDs, financials, names, timestamps, joined fields like branch/staff)
Apply dynamic date filters (today, last 7 days, custom range)
Choose visualization (table, bar, line, pie) and preview results instantly
Export as Excel, CSV, JSON or PDF (Excel exports include formatted headers and autosized columns)
Save templates for reuse and share them across your team
Step-by-step: How to create your first custom report
Follow these steps inside your Mobstep dashboard — you’ll have a usable report in minutes.
Step 1 — Open Reports
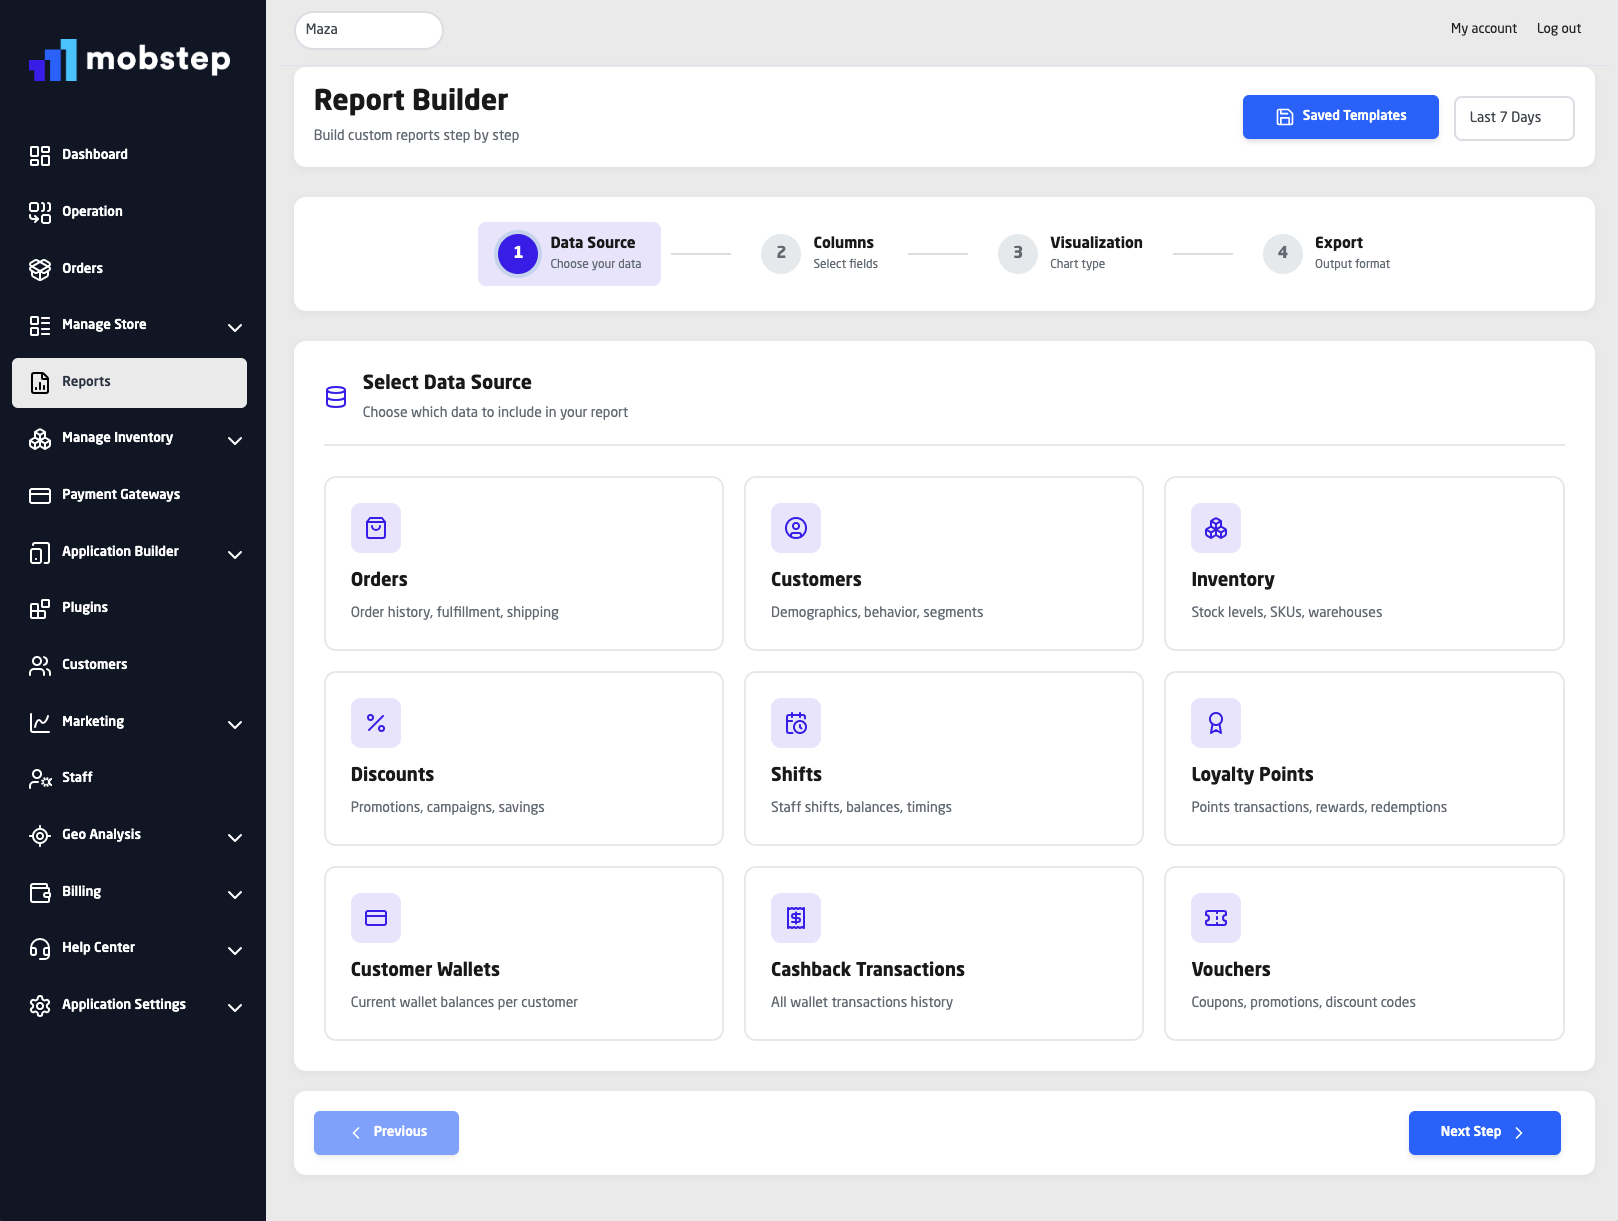
Step 2 — Select the data source
In Reports, pick the card for the data you want to analyze (e.g., Orders, Discounts, Customers).
Each card shows an icon, name and short description to help you choose.
Click the data source to continue.
Example: To analyze coupon effectiveness, choose Discounts.
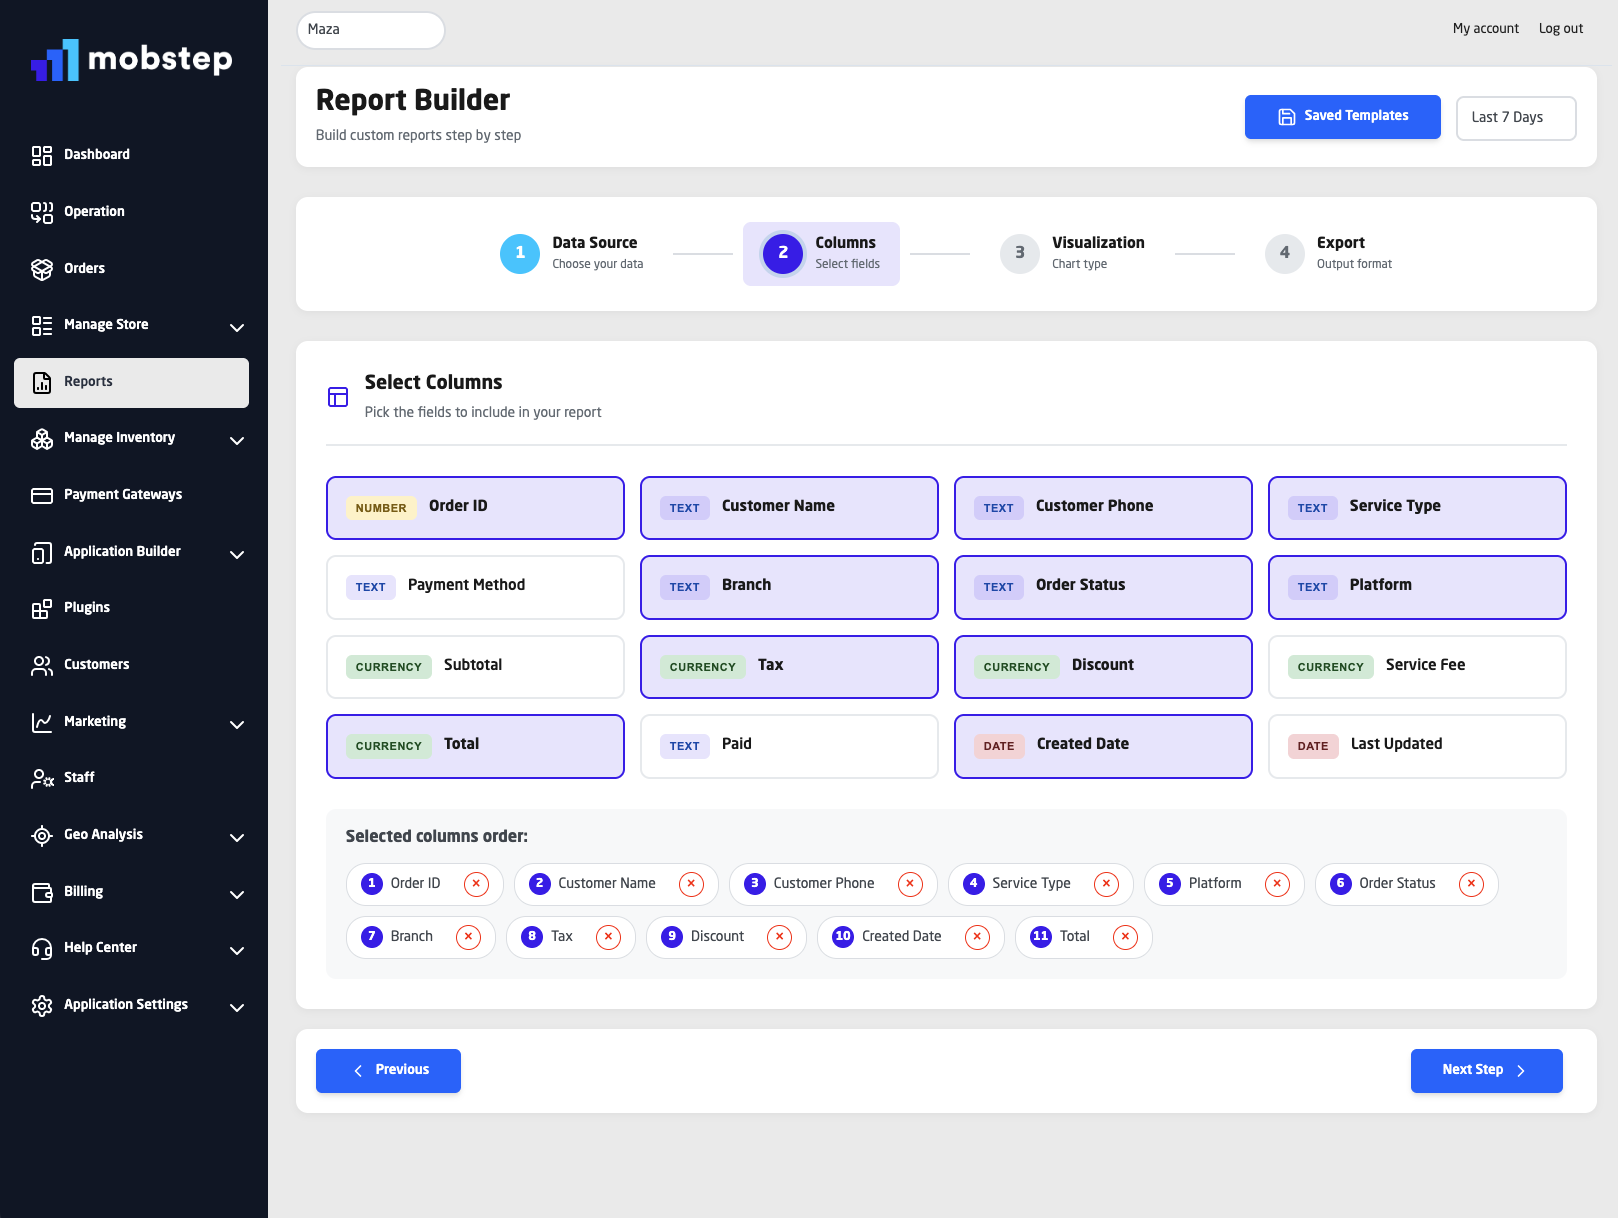
Step 3 — Choose your columns (fields)
Browse the fields listed for that data source. Fields include customer info, totals, dates, statuses and related fields (branch name, staff name).
Click fields to add them — selected fields get a checkmark and appear in the preview.
Start with the essentials (ID, Date, Amount) then add context fields (Branch, Customer, Payment Method).
Pro tip: For sales reports add Order Date, Branch, Total, Payment Method, Platform.
Step 4 — Apply filters & date range
Open the date selector and choose a preset (Today / Last 7 Days / This Month) or set a Custom Date Range.
Add filters (e.g.,
Branch = CairoorDiscount Applied = true) to narrow results.Save commonly used filters as part of a template (optional).
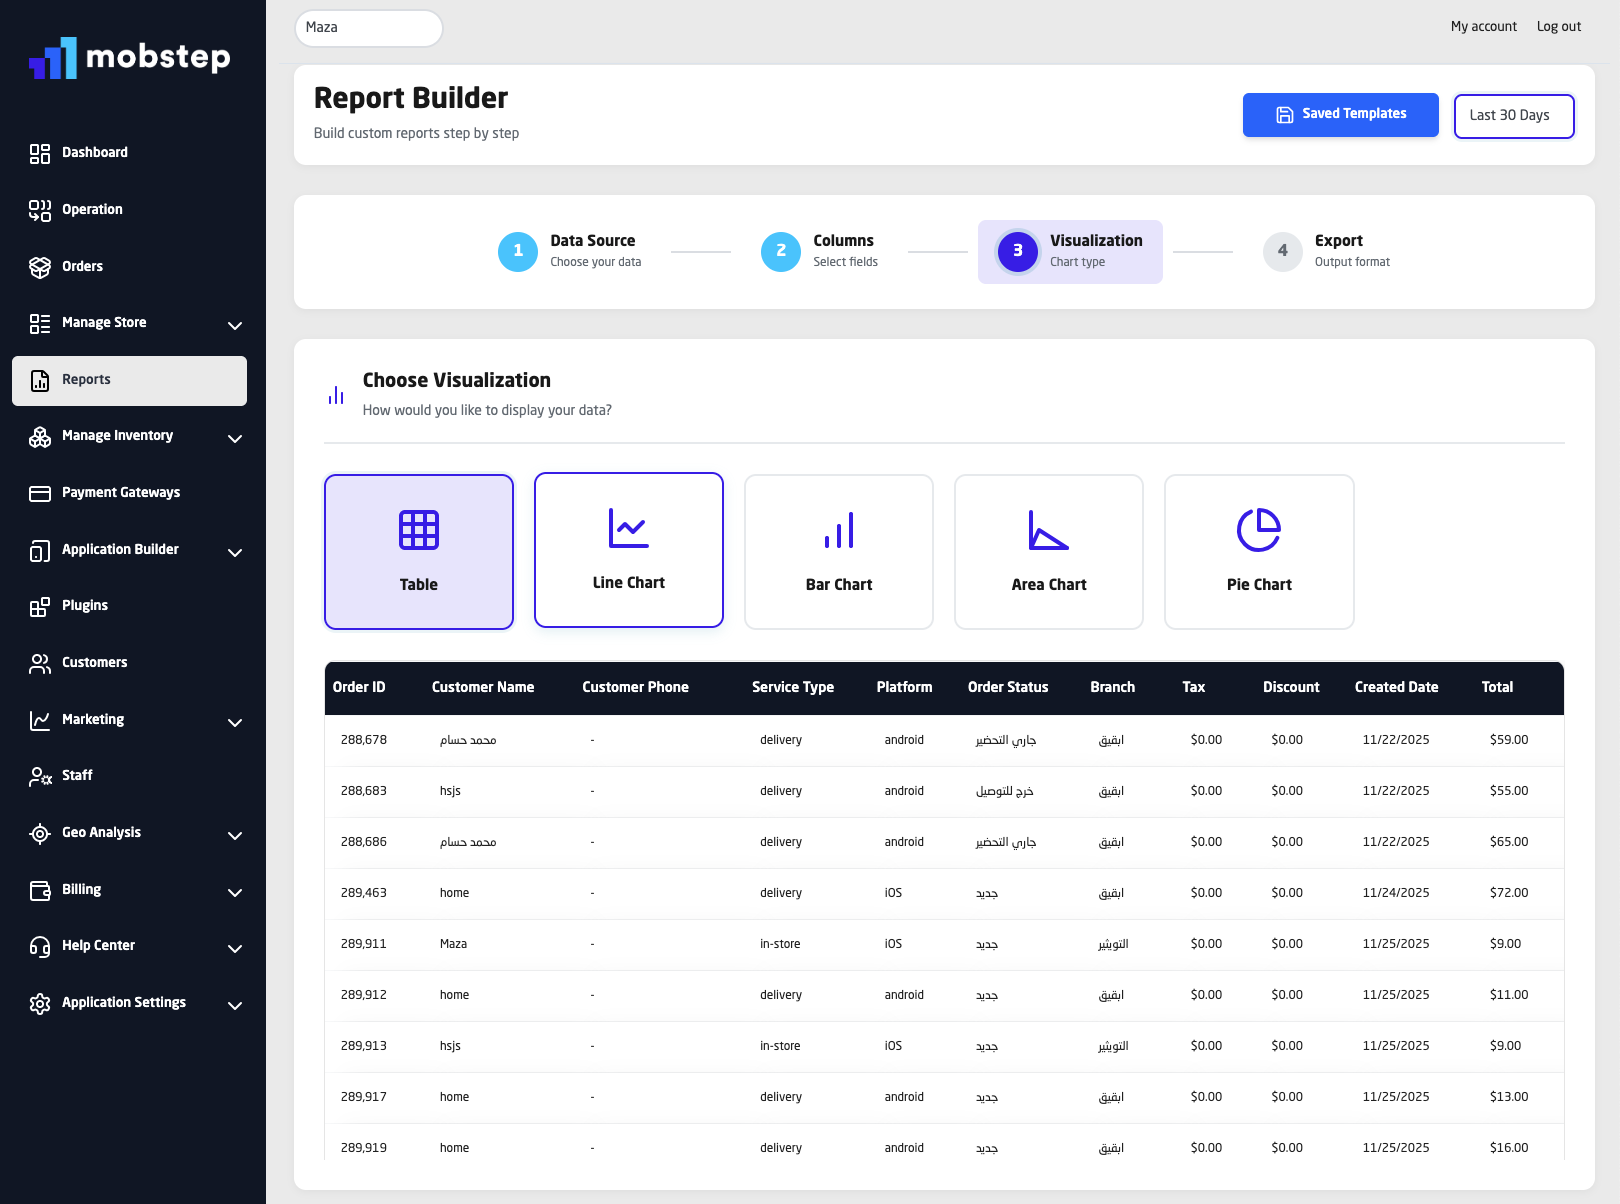
Step 5 — Choose visualization and preview
Select how you want to view results: Table, Bar Chart, Line Chart, or Pie Chart.
The preview updates instantly so you can validate results.
Use Tables for record-level checks.
Use Bar Charts to compare branches or categories.
Use Line Charts for time trends.
Use Pie Charts for distribution (e.g., payment methods).
Step 6 — Save the report template
Click Save Template (name it e.g.,
Weekly Sales by Branch).Choose visibility: Private (yourself) or Team (share with app colleagues).
Saved templates are listed under Saved Reports for one-click access.
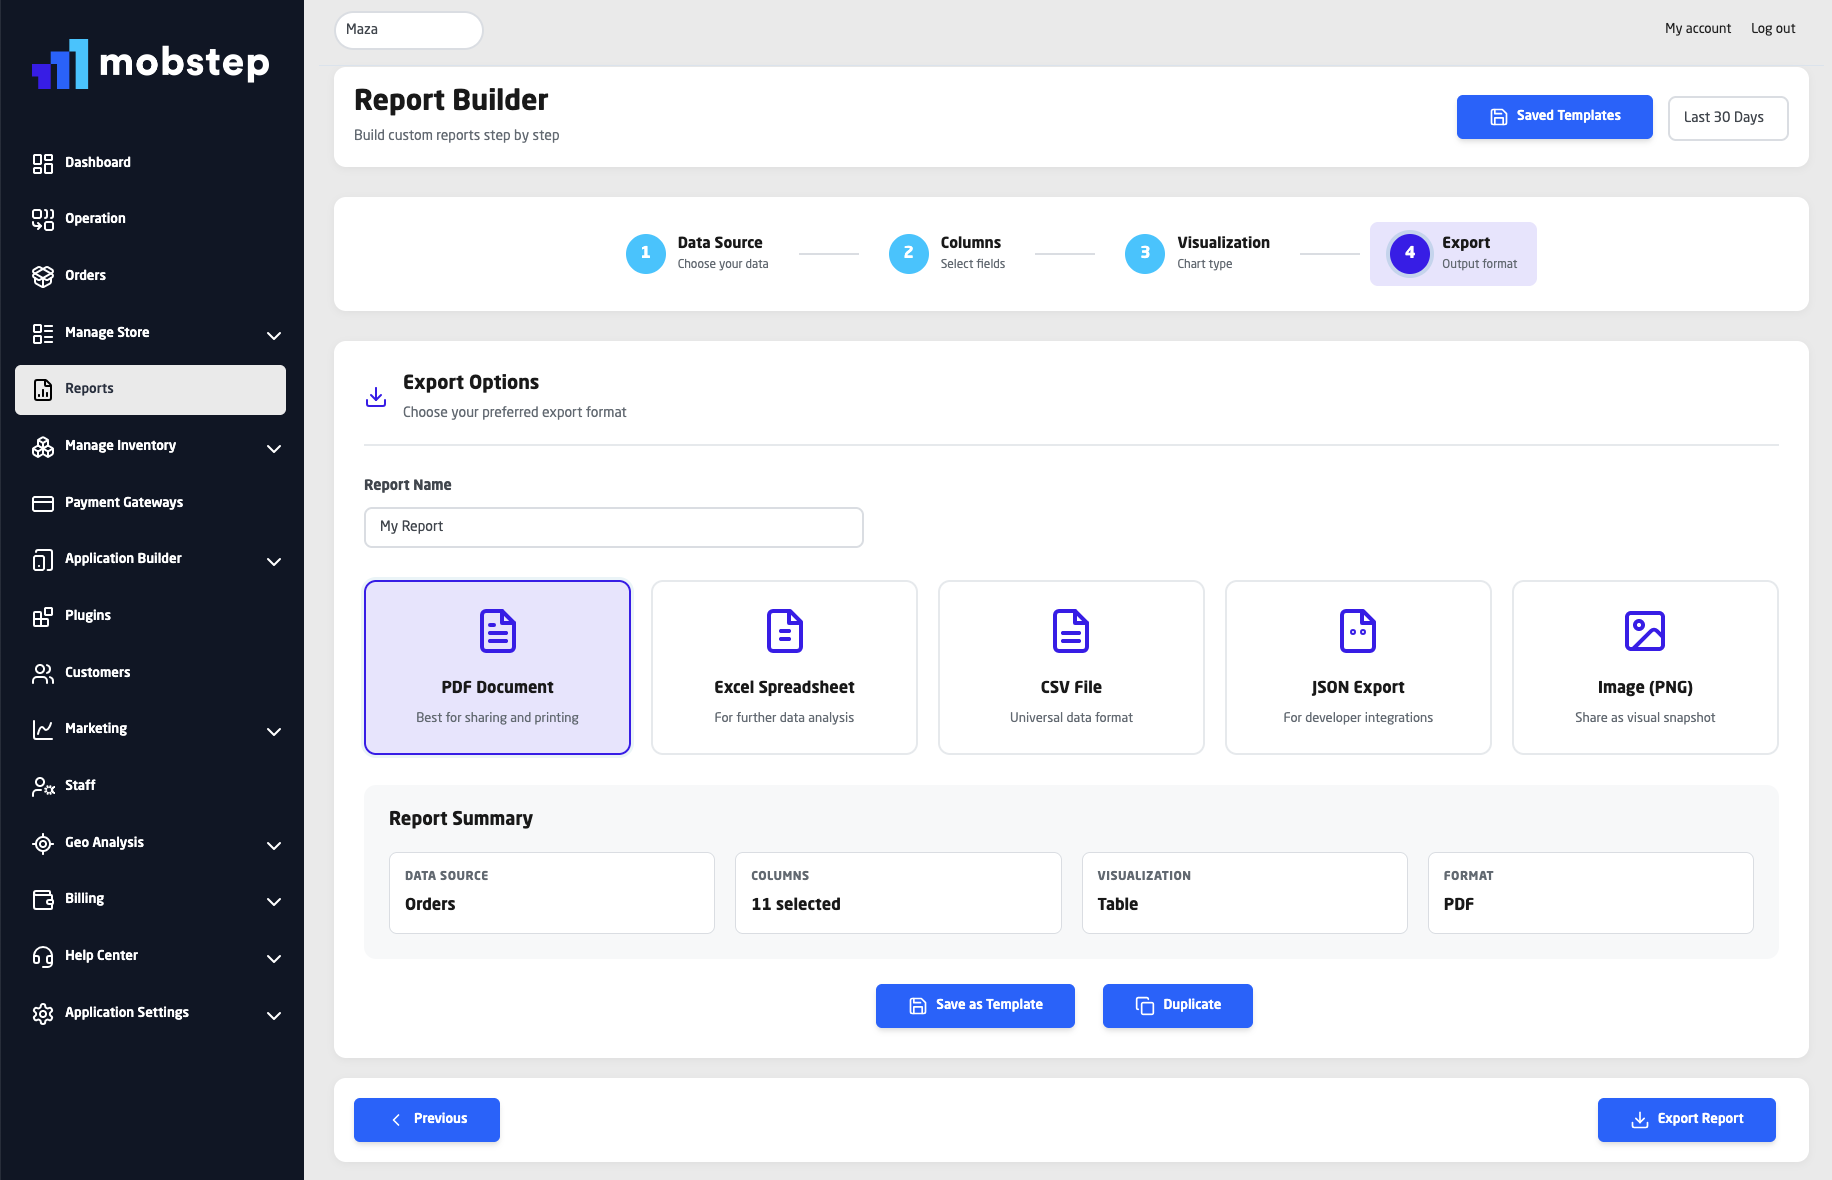
Step 7 — Export or schedule (Coming soon: scheduling)
Click Export Report and select format: Excel, CSV, JSON, PDF.
Exports are generated securely and downloaded to your device.
Excel exports include styled headers and auto-sized columns.
File names include the report name + timestamp.
(Planned) Use scheduled reports to email recurring reports automatically.
Real examples (templates you can create right away)
Weekly Sales by Branch
Data: Orders
Columns: Order Date, Branch, Total, Platform, Payment Method
Visualization: Bar chart
Coupon Performance
Data: Discounts
Columns: Coupon Code, Order ID, Discount Amount, Order Date, Customer Name
Visualization: Table
Inventory Low Stock Alert
Data: Inventory
Columns: SKU, Product Name, Current Stock, Reorder Level, Warehouse
Visualization: Table (filter
Current Stock <= Reorder Level)
Staff Shift Cash Reconciliation
Data: Shifts
Columns: Staff Name, Start Time, End Time, Start Balance, End Balance
Visualization: Table
Active Wallets Snapshot
Data: Customer Wallets
Columns: Customer Name, Current Balance, Last Transaction Date
Visualization: Table
Best practices for app owners (short checklist)
Start simple: build a minimal report, validate results, then expand.
Use meaningful date ranges that match your business cycle (daily for fast-food, weekly for retail).
Save templates for recurring tasks (daily sales, weekly coupon audit).
Pick visualization to match the question — trends vs. breakdowns vs. raw records.
Export for stakeholders: Excel for finance, PDF for leadership decks, CSV/JSON for integrations.
Next steps (for app owners)
Go to Reports in your Mobstep dashboard.
Create a simple
Last 7 Days Salesreport (Orders → Date, Branch, Total).Save it as a template and export to Excel.
Tell your Ops or Finance team — they’ll thank you.